Monitoring
The Monitoring tab provides a live snapshot and historical view of your container’s system usage. It helps you monitor key performance indicators to ensure optimal operation and avoid exceeding resource allocations. This tab also includes a Processes view, offering real-time visibility into active system-level processes running inside the container.
How To Access
Applications → Management → Manage App → Monitoring
Open the Management tab in the Applications menu, select an application from My Active Apps, click Manage, and open the Monitoring tab.
Backend Selector
At the top right you'll find a FluxNode IP selector, letting you choose which node you want to inspect or control. This allows you to manage individual node instances of your app. A reload button is also available to refresh the list of currently active FluxNodes running your application.

Stats Overview
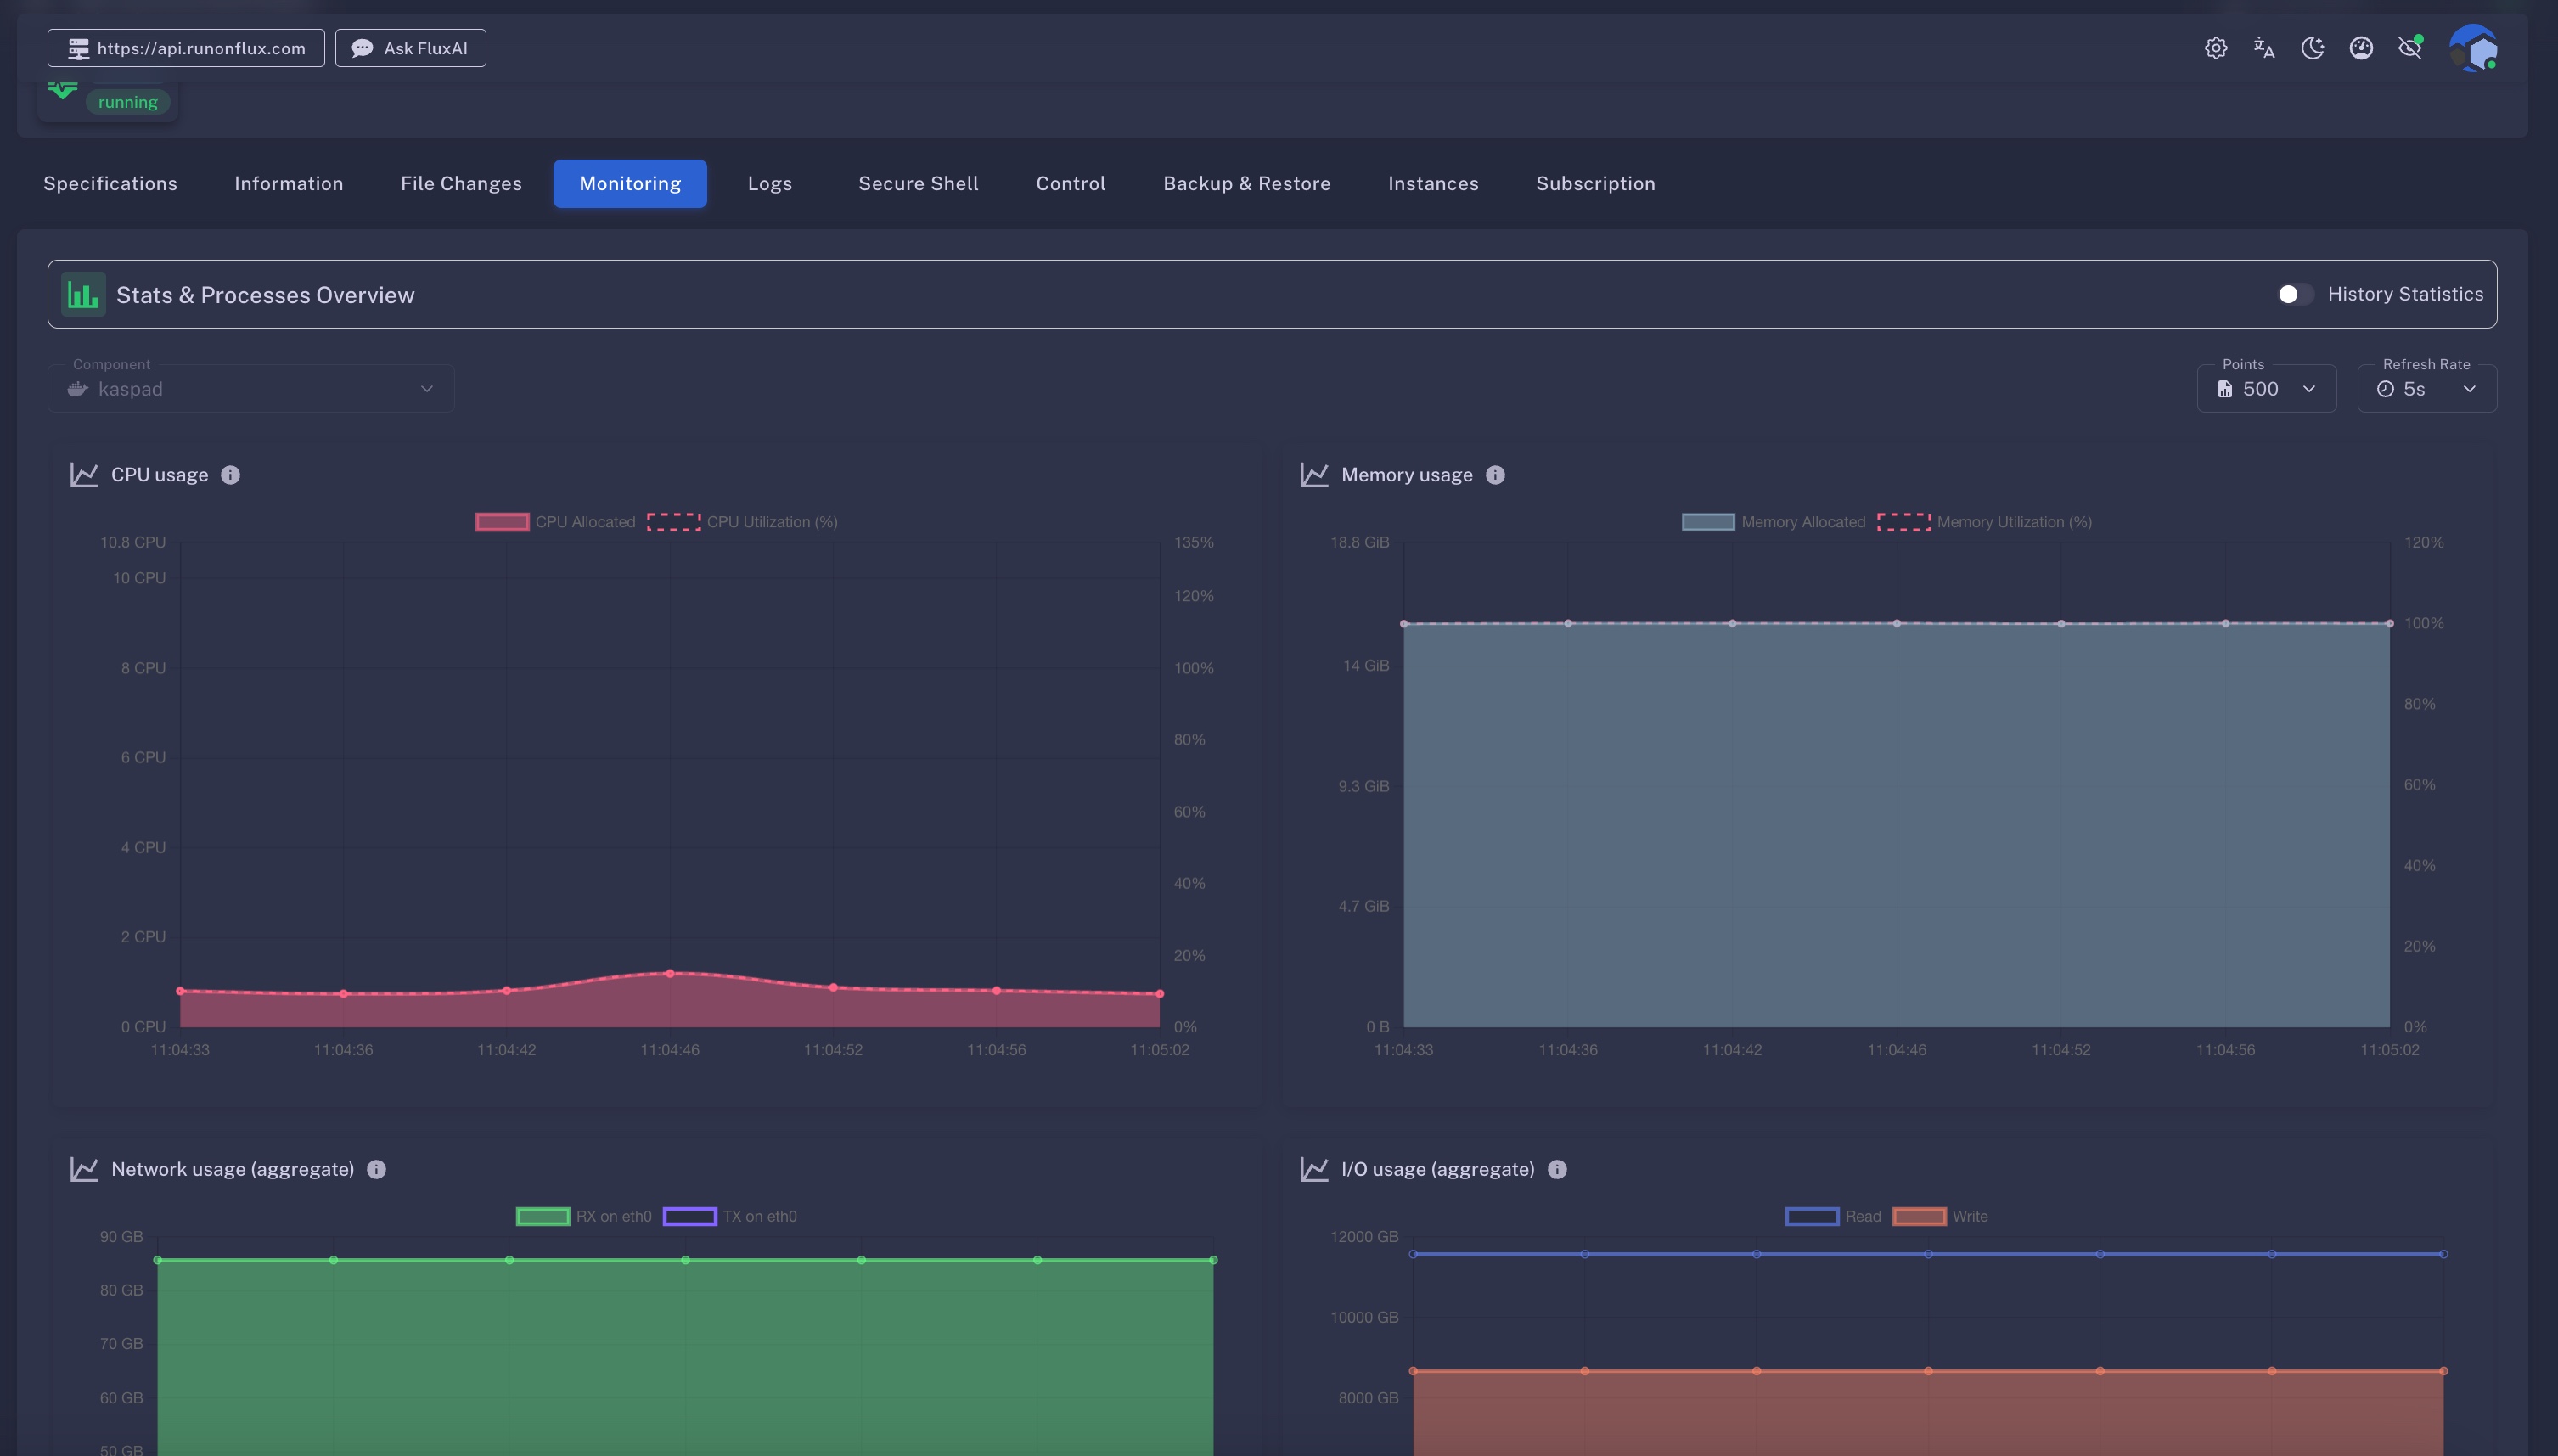
Tools Overview
- Container Selector: Choose the specific container to monitor (for multi-component apps).
- List Amount Selector: Limit the number of data points shown on the charts.
- Interval Refresher Selector: Set how often the charts refresh with new data.
- History Statistics: Toggle to switch to historical statistics view.
What You'll See
- CPU Usage: Live CPU load inside the container.
- Memory Usage: Real-time RAM consumption.
- Network Usage (aggregate):
- TX: Transmit (outgoing data)
- RX: Receive (incoming data)
Monitor for bandwidth, throughput, and latency to identify bottlenecks and optimize performance.
- I/O Usage (aggregate): Live input/output activity across network interfaces.
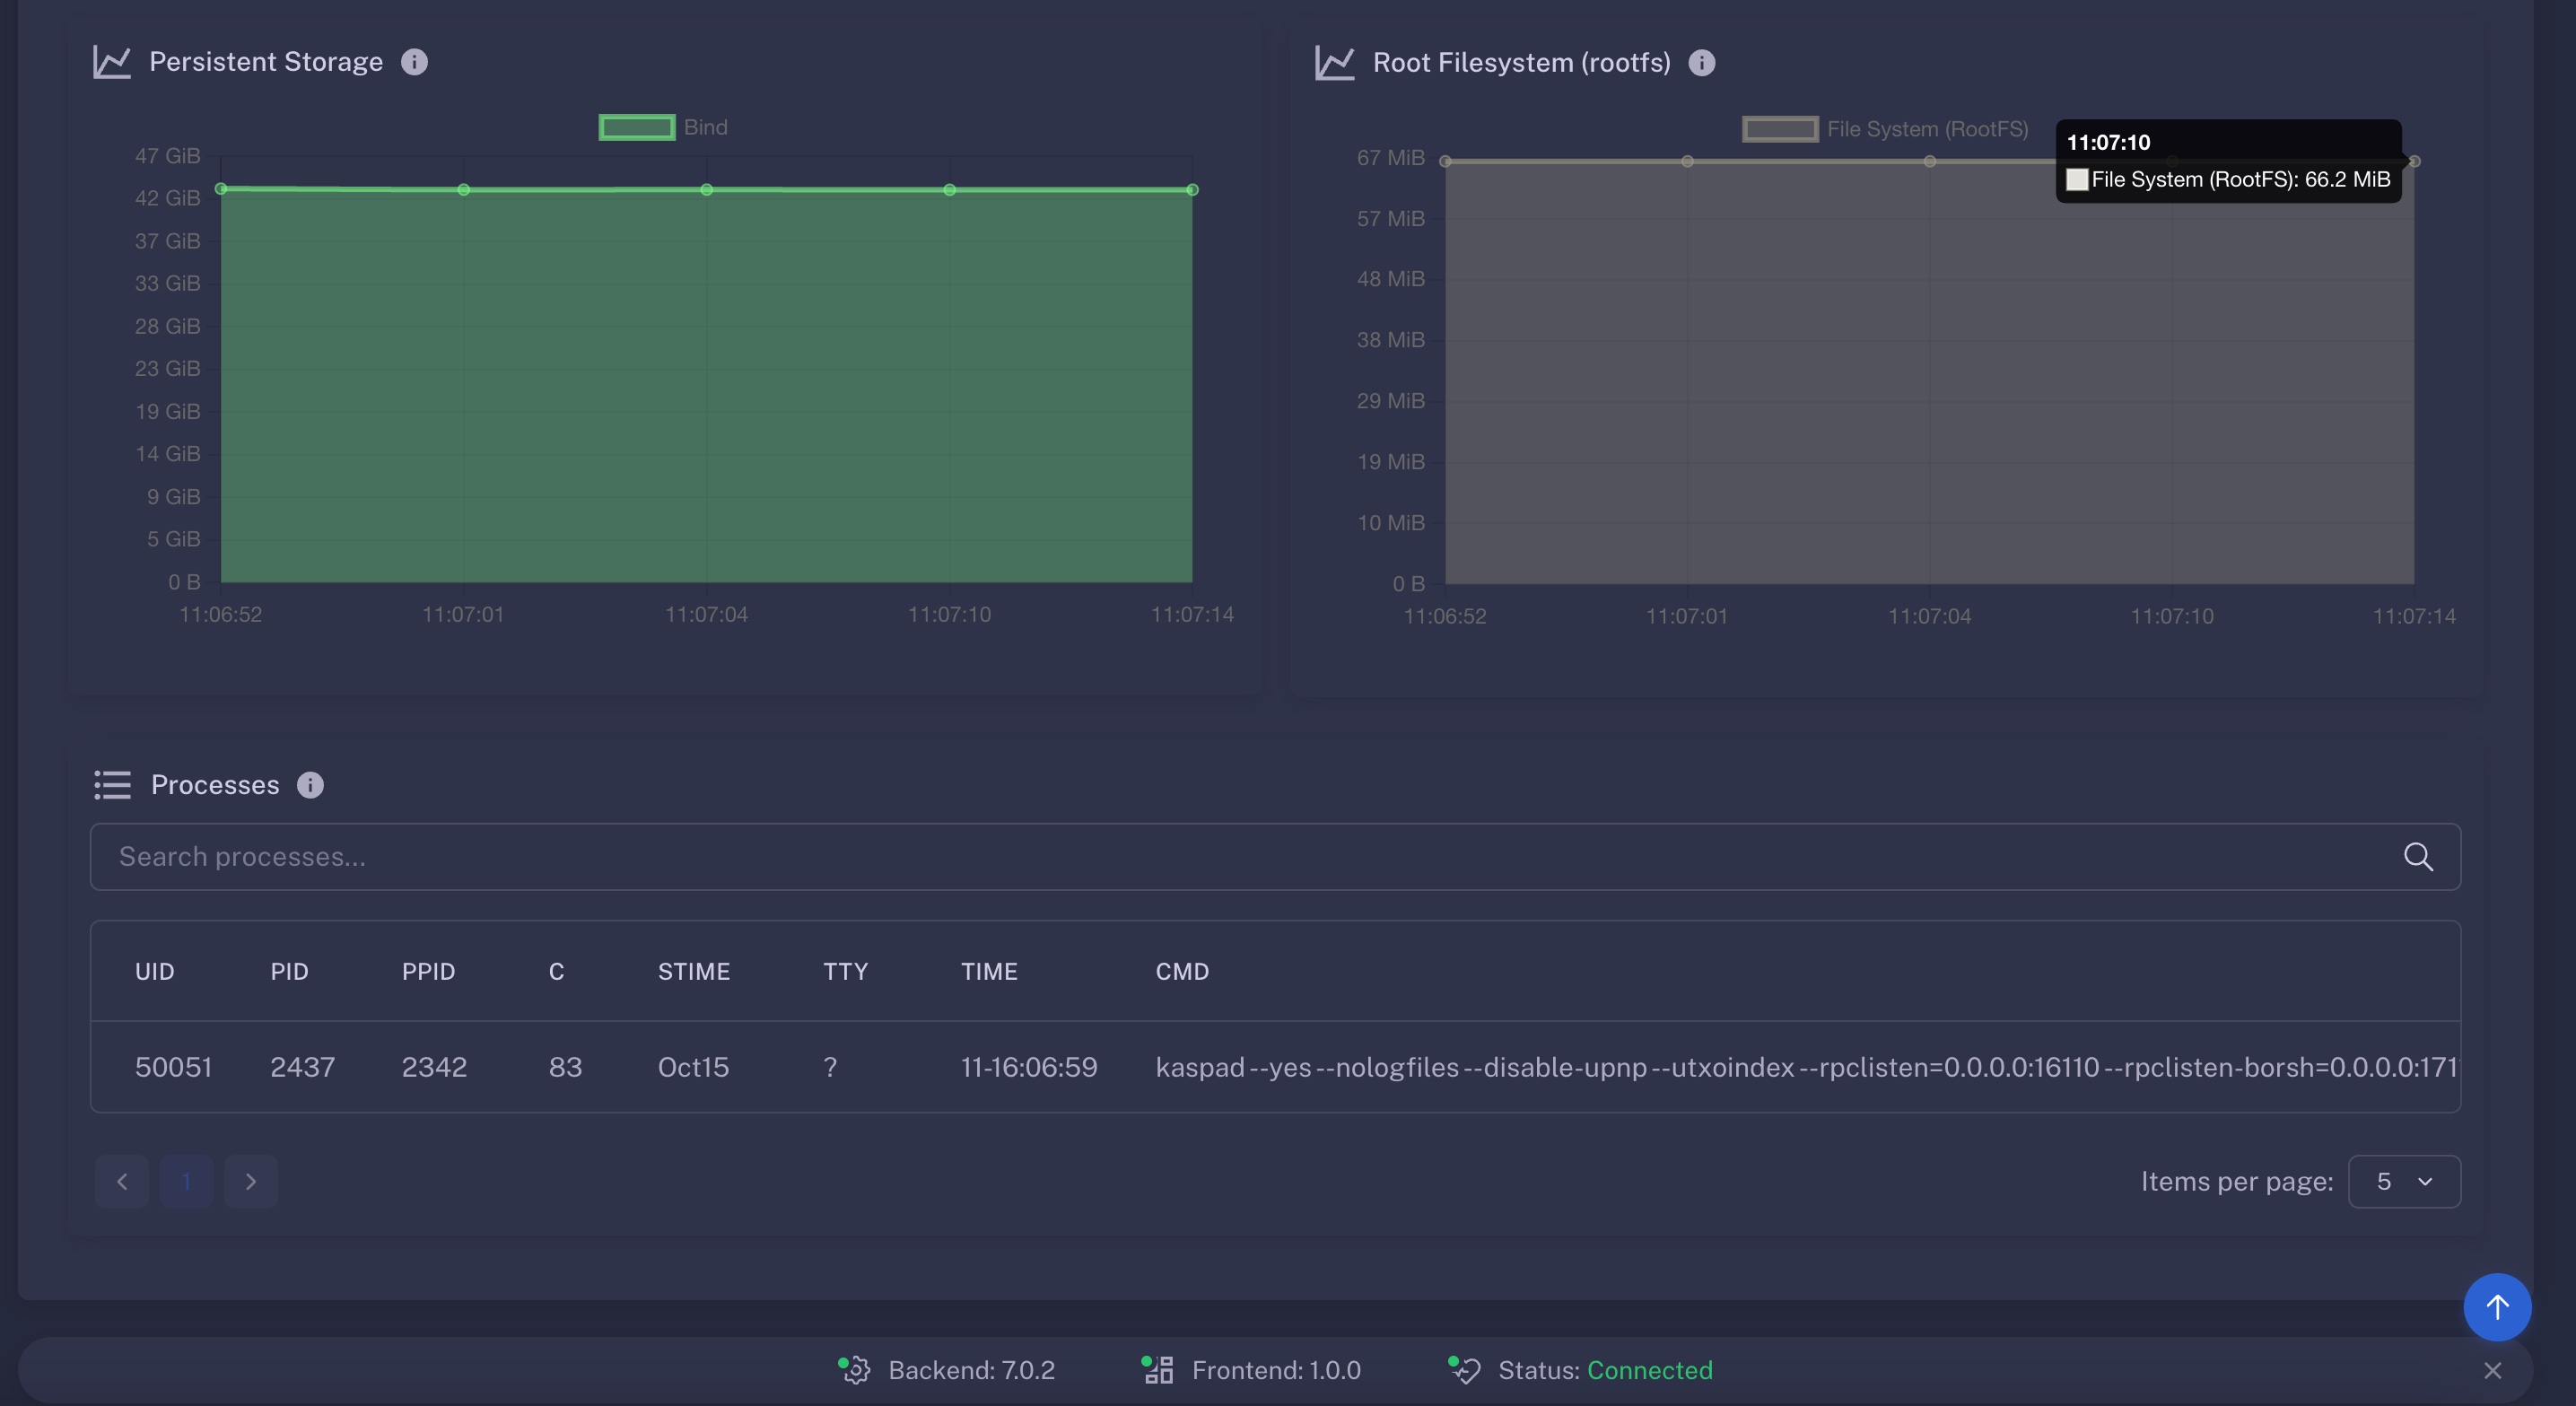
- Persistent Storage:
- Data retained across restarts and updates
- Crucial for monitoring disk space usage and preventing exhaustion
- Root Filesystem (rootfs):
- Temporary storage used during container runtime
- Monitoring helps avoid space issues and unexpected crashes
Processes Overview
The Processes section shows a live snapshot of active system-level processes inside your container, captured at the time of the scan. This information helps you validate runtime behavior, debug issues, and identify anomalies.
What You'll See
This view presents standard Linux-style process data (similar to the ps command), including:
- Process ID (PID)
- User
- CPU and memory usage
- Command path
- Parent-child process relationships
Why This Is Useful
- Validate Expected Processes: Ensure only your app and intended components are running.
- Detect Anomalies or Threats: Unrecognized or unauthorized processes (especially under root) can signal issues.
- Debug Startup Issues: Investigate failed or orphaned components using process trees.
- Audit Container Activity: Combine with File Changes and Logs tabs to reconstruct behavior.