Logs
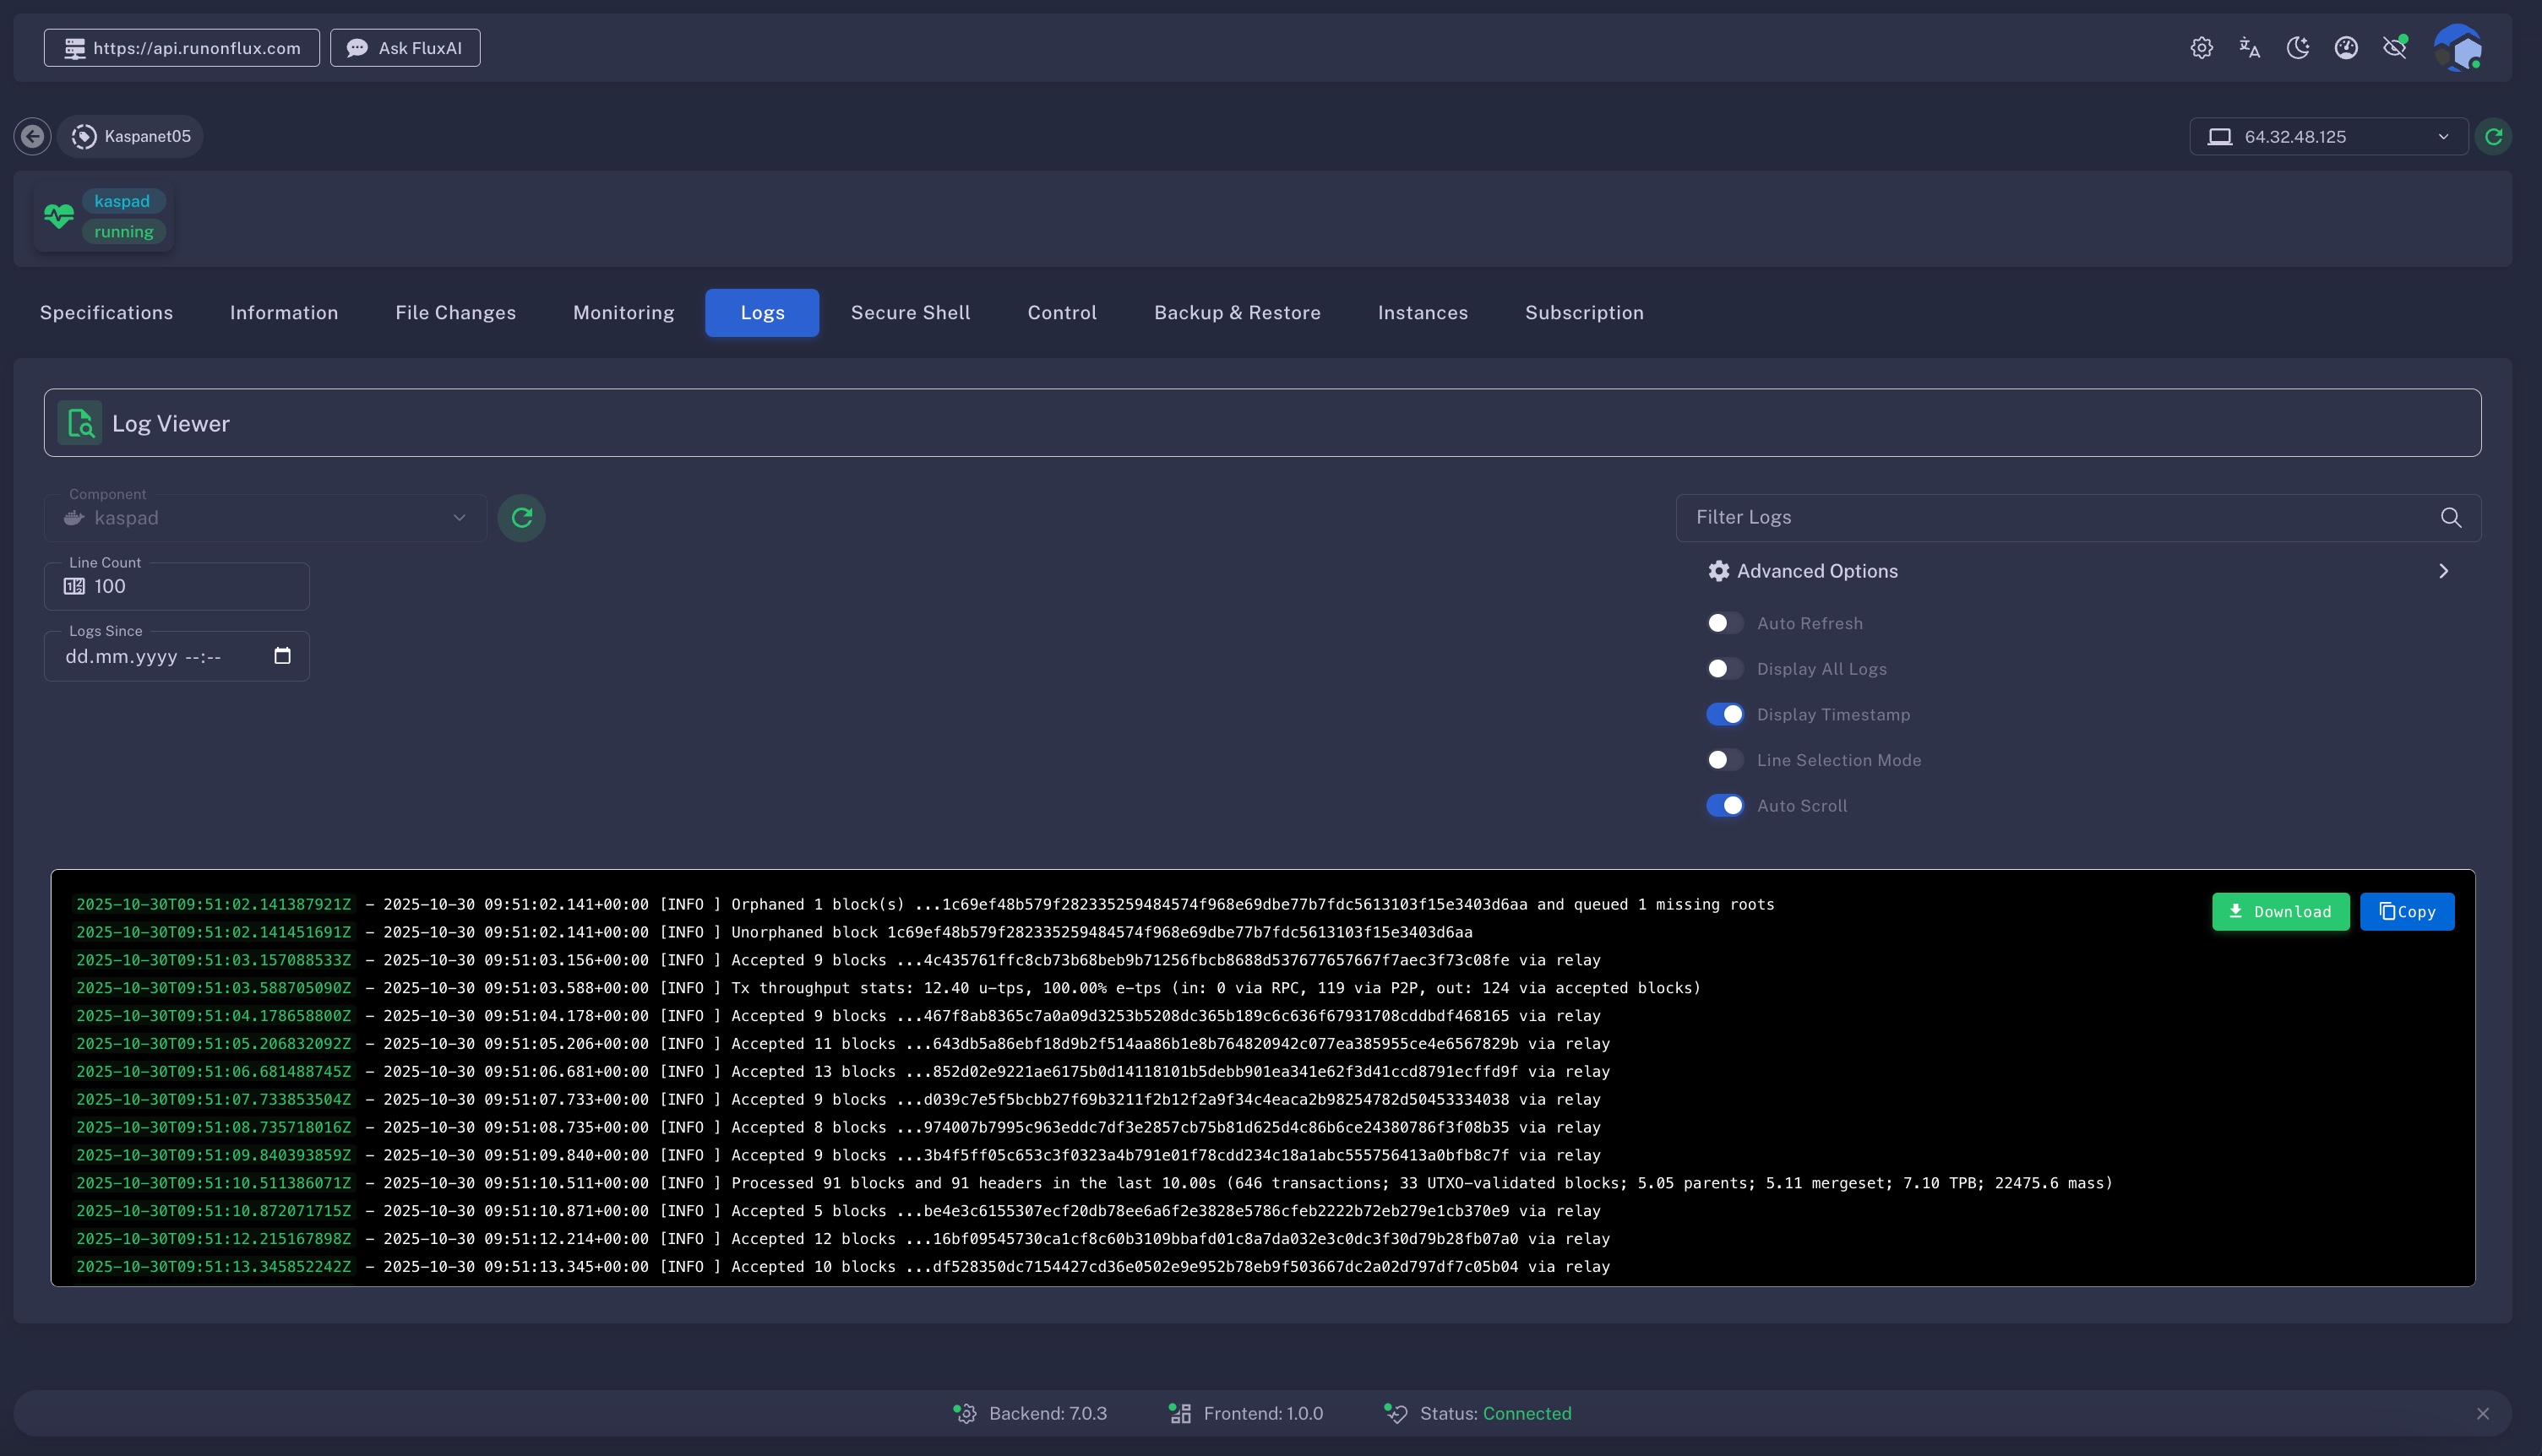
The Logs tab provides direct access to the recent logs generated by your application. It’s a key tool for diagnosing issues, monitoring behavior, and confirming successful execution.
How To Access
Applications → Management → Manage App → Logs
Open the Management tab in the Applications menu, select an application from My Active Apps, click Manage, and open the Logs tab.
Backend Selector
At the top right you'll find a FluxNode IP selector, letting you choose which node you want to inspect or control. This allows you to manage individual node instances of your app. A reload button is also available to refresh the list of currently active FluxNodes running your application.

What You'll See
- Component Selector – Choose the specific container component whose logs you want to view.
- Line Count – Define how many lines of logs to retrieve.
- Logs Since – Filter logs by date. Format:
dd.mmm.yyyy --:-- - Search Filter – Enter keywords to filter the log output.
- Download Button – Download the current log output for analysis or sharing with support.
- Copy Button– Copy the current log output to your clipboard for external use or debugging.
Advanced Options Toggle Settings:
- Auto-Refresh – Automatically refreshes logs every few seconds.
- Fetch All Logs – Retrieve the complete set of logs from the selected container.
- Display Timestamp – Show timestamps alongside each log entry.
- Line Selection – Toggle between free text selection and individual log line selection for copying.
- Auto-Scroll – Enable or disable automatic scrolling to the latest log entries.
Why Is This Useful
- Troubleshooting app behavior or crashes
- Reviewing error messages or stack traces
- Verifying that the app launched successfully
Make it a habit to review this tab after deployment or when investigating unexpected behavior.