Overview
The Overview tab provides a high-level snapshot dashboard of the FluxCloud network status and key metrics.
What You'll See
This dashboard displays the following information:
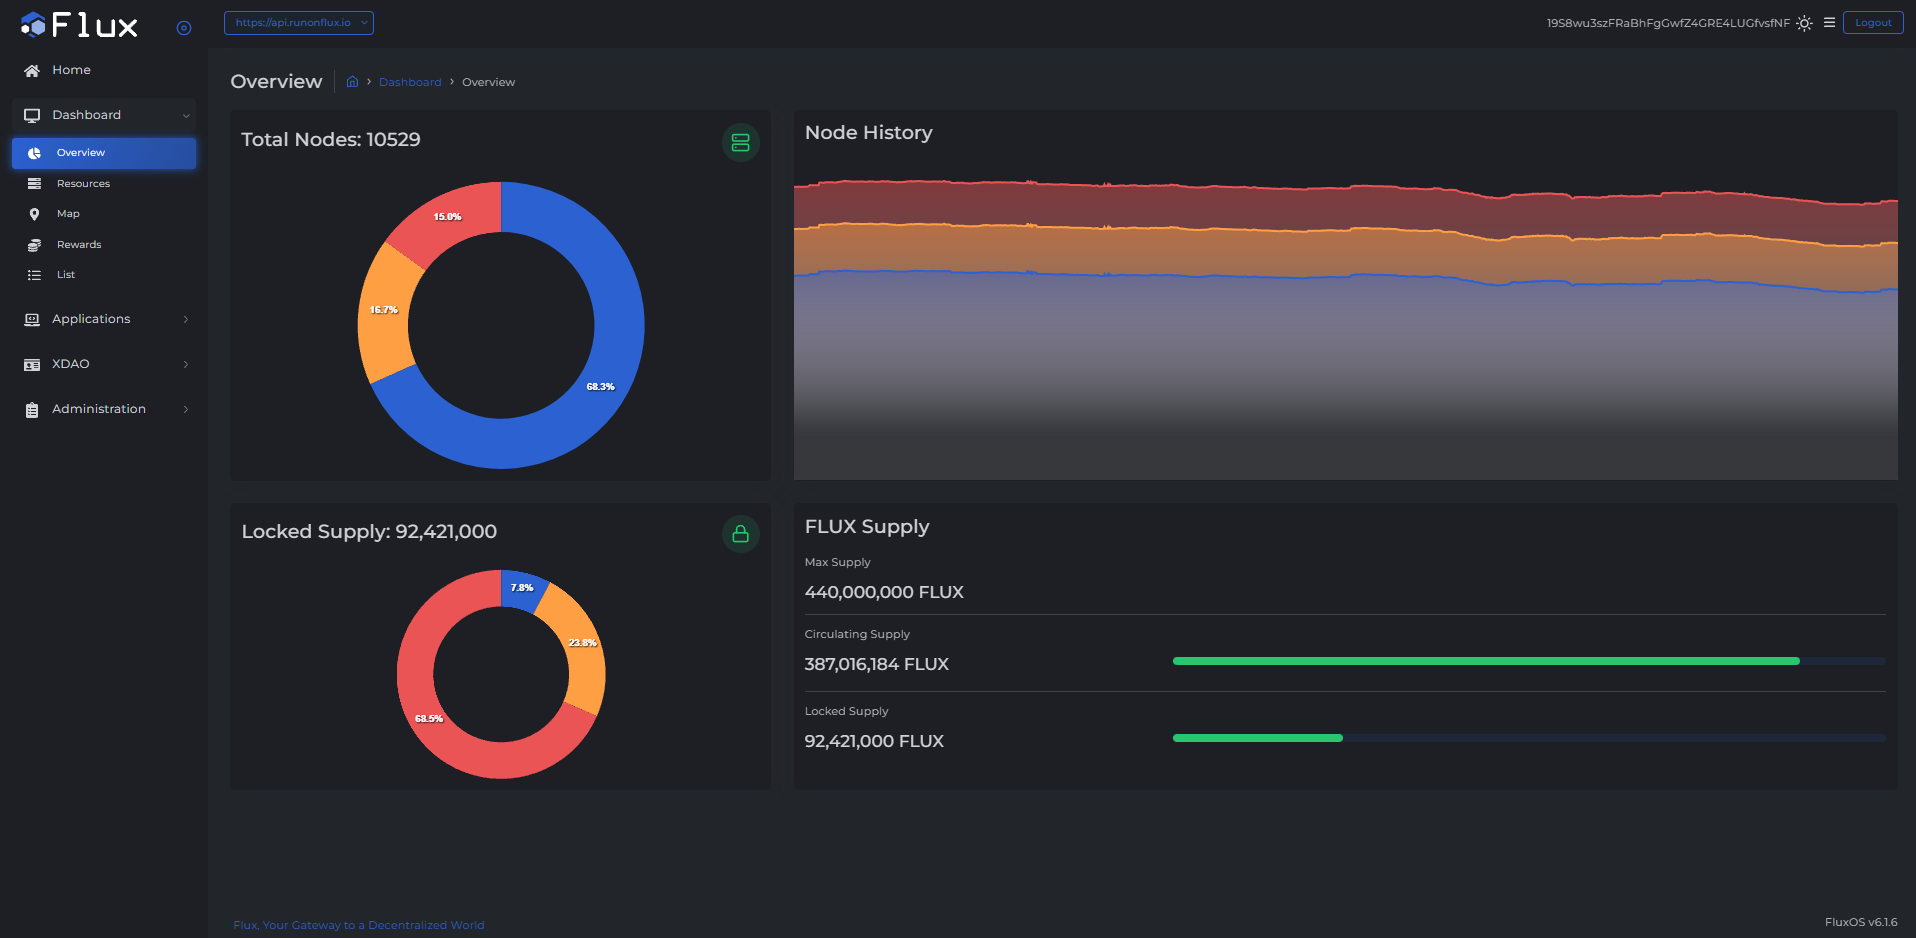
- Total Nodes
- Shows the total number of active FluxNodes supporting the network.
- A visual breakdown by FluxNode type (Cumulus, Nimbus, Stratus), displaying the total count and percentage compared to the overall total.
- Node History
- A one-month time series graph of the total number of FluxNodes over time.
- Tracks the relative proportions and changes in each node class.
- Locked Supply
- Displays the total number of FLUX tokens locked across the network to run FluxNodes.
- Includes a chart showing the proportion of locked supply by FluxNode category.
- FLUX Supply
- Visual indicators display the current supply levels relative to the maximum supply.
- Max Supply – The total supply of FLUX tokens.
- Circulating Supply – FLUX tokens actively circulating.
- Locked Supply – FLUX tokens locked as collateral in FluxNodes.
- Visual indicators display the current supply levels relative to the maximum supply.